Intrigued by the finding that Sociology is lagging a bit behind concerning (new) methods for data exploration and visualization, and with the financial support of the ISA, we invite you all to join us for a peak across the disciplinary borders.
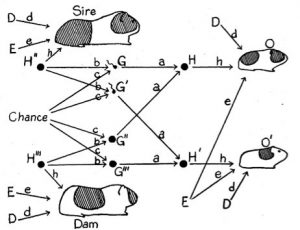 First published (Sewell, 1920) statistical path diagram, visualised using guinea pigs
With two speakers at the focal point of innovation in data exploration, visualization and presentation and a “bring-your-own-data” workshop, we hope to offer members and those interested an inspiring afternoon program.
Program
In the afternoon program we combine a workshop and two interventions with discussion:
- Lecture by Paul Girard (Science Po médialab): “Studying and exploring digital traces through datascapes – the interdisciplinary experience at Science Po médialab”
- Lecture by Jan Aerts (Data Analysis Group, KU Leuven): “Insights from big data – tackling size and complexity”
- Bring-your-own-data workshop by Maarten Lambrechts (datajournalist, ex-De Tijd): “Effective science communication in practice: what can Sociology learn from data journalism?”
Speakers’ bio
 Paul Girard
 Maarten Lambrechts
 Jan Aerts
Paul Girard (website, @paulanomalie) is specialized in driving collaborative projects between social and technical research domains. As digital manager at the Science Po médialab he researches and develops — within a team of sociologists, philosophers of science, engineers and programmers — novel methods for exploring and narrating data. This médialab was founded in 2009 as the 10th research center of Science Po, founded by Bruno Latour and directed by Dominique Cardon with the goal of supporting social sciences and humanities with grasping the research opportunies of the tremendous amount of data generated by our modern, digital lives.
Maarten Lambrechts (website, @maartenzam) gives as a data journalist and consultant trainings, workshops and keynotes on data journalism and data visualisation. His inspiration is sourced from a.o. his experience as a data journalist at the Belgian national newspapers De Tijd / L’Echo and MO Magazine. In his visualisation- and programming work the border between science communication, journalism and statistical pedagogy blurs, as illustrated by interactive visualisations of for example uncertainty in electoral polls or sociodemographic characteristics of muncipalities.
Coming from a background in molecular biology and genetics, Jan Aerts (website, @jandot) directs his research towards data visualisation and visual analytics. As head of the Visual Data Analysis Group at the KU Leuven, he coordinates research on methods and tools to obtain more insights in large and/or complex datasets, ranging from gene-sequences to social network analyses of mediaeval Flemish tapestry merchants. For this, automated analysis techniques are combined with interactive data visualization to support hypothesis generation and the discovery of unexpected phenomena.
Workshop format
When registering, participants can indicate if they want to be contacted to provide data (and possibly existing visualisations of that data) from their research/work. If possible, this data will be used to prepare and illustrate the interactive workshop by Maarten Lambrechts. If there is no suitable participant data, Maarten will use a.o. data from the VUB-TOR Time Use Survey.
This two hour workshop will focus on ideas and inspiration from data journalism that might help effective science communication through visualisation, as well as general visualisation principles in data exploration and presentation.
Practical information
- We start at 13h and finish the program by 17h.
- The venue is the Muntpunt in Brussels (Munt 6, 1000 Brussel), which is easily reachable with public transportation, e.g. a ten minute walk from trainstation Brussels-Central.
- The language during the talks and workshop will be English.
- We provide coffee during the break and a voucher for a drink after the event at the venue.
- For questions, contact info@sociologie.be.
Register as participant
Please register as soon as possible, and before the 27th of November 2017, as the the number of available seats is limited.
You can register online, and will receive a confirmation. If we are at capacity, you are added to the waiting list, and if seats become available due to non-payment or cancellations, you will be notified (following registration order).
The participation fee is
- 15€ voor participants that are not a member of VVS/NSV.
- free for members of the VVS/NSV.
If you are a student or a researcher without own funding, and certain you will attend, please contact us for waiving the fee.
Payment is due also before the 27th of November 2017, transfered to IBAN BE18 5230 8086 7965 (BIC “TRIO BE BB”). Please indicate “Event VVS [your name]” in the comment field.
Included in the registration is a voucher for a drink at the Muntpunt Café, which provides an nice opportunity to have a chat afterwards.